FranchiseOS Reporting System
Designing a multi-location reporting system that helps franchise teams compare performance, manage visibility by role, and act faster across organizational levels.
TIMELINE
80 hours
ROLE
Product Designer
UX Researcher
PROJECT TYPE
Concept case study
SCOPE
Multi-location and multi-role franchise reporting system
OVERVIEW
This concept explores a more progressive approach to identity verification for a Canadian retail bank mobile app. Instead of sending every applicant through the same document-first flow, the experience starts with the least intrusive lawful verification path available, then steps up only when mismatch, product risk, or fraud signals require stronger proof. The goal was to design a verification experience that better balances compliance, privacy, accessibility, and completion by treating identity proofing as a risk-based product flow rather than a single fixed gate.
THE CHALLENGE
Multi-location restaurant franchises operate across layered organizational structures, where corporate leaders, area managers, and store managers each need different levels of visibility into performance data. Most reporting tools support individual locations well, but are not designed around multi-level franchise governance.
This created a product challenge: how might a reporting system reflect organizational hierarchy while still maintaining clarity, speed, and the right level of access for each role?

How might we help different roles see the right data without creating information overload?
How might we support cross-location comparison while preserving organizational hierarchy?
How might we make permissions and visibility feel like part of the product, not a disconnected admin layer?
STATUS QUO
Most restaurant management platforms offer dashboards, reporting views, and permissions, but they tend to optimize for either single-location operations or broad financial depth. What felt missing was a reporting experience built specifically for franchise governance — one that could adapt visibility by role, support cross-location comparison, and scale across multiple organizational levels. Rather than designing another generic reporting dashboard, this project explored how reporting could be structured around hierarchy, permissions, and decision-making responsibility from the start.
PROCESS
- Understanding the reporting problem
I started by defining the reporting challenge at the system level rather than the screen level. The core issue was not simply “show more data,” but how to structure reporting around organizational hierarchy so that different roles could see the right level of information without overwhelming the interface.
- Studying existing patterns and gaps
I reviewed existing restaurant and franchise reporting tools to understand how competitors handled dashboards, permissions, and multi-location comparison. This helped me identify a consistent gap: many tools optimized either for single-location usability or financial depth, but not for franchise-wide reporting governance as a unified experience.
- Designing around roles, hierarchy, and governance
From there, I defined the product around three core ideas: role-adaptive visibility, fast cross-location comparison, and scalable permissions. I mapped what each role needed to accomplish, then used that structure to guide feature prioritization, information hierarchy, and navigation decisions across the reporting system.
- Refining the interface into a scalable product system
From there, I defined the product around three core ideas: role-adaptive visibility, fast cross-location comparison, and scalable permissions. I mapped what each role needed to accomplish, then used that structure to guide feature prioritization, information hierarchy, and navigation decisions across the reporting system.
FINAL RESULT
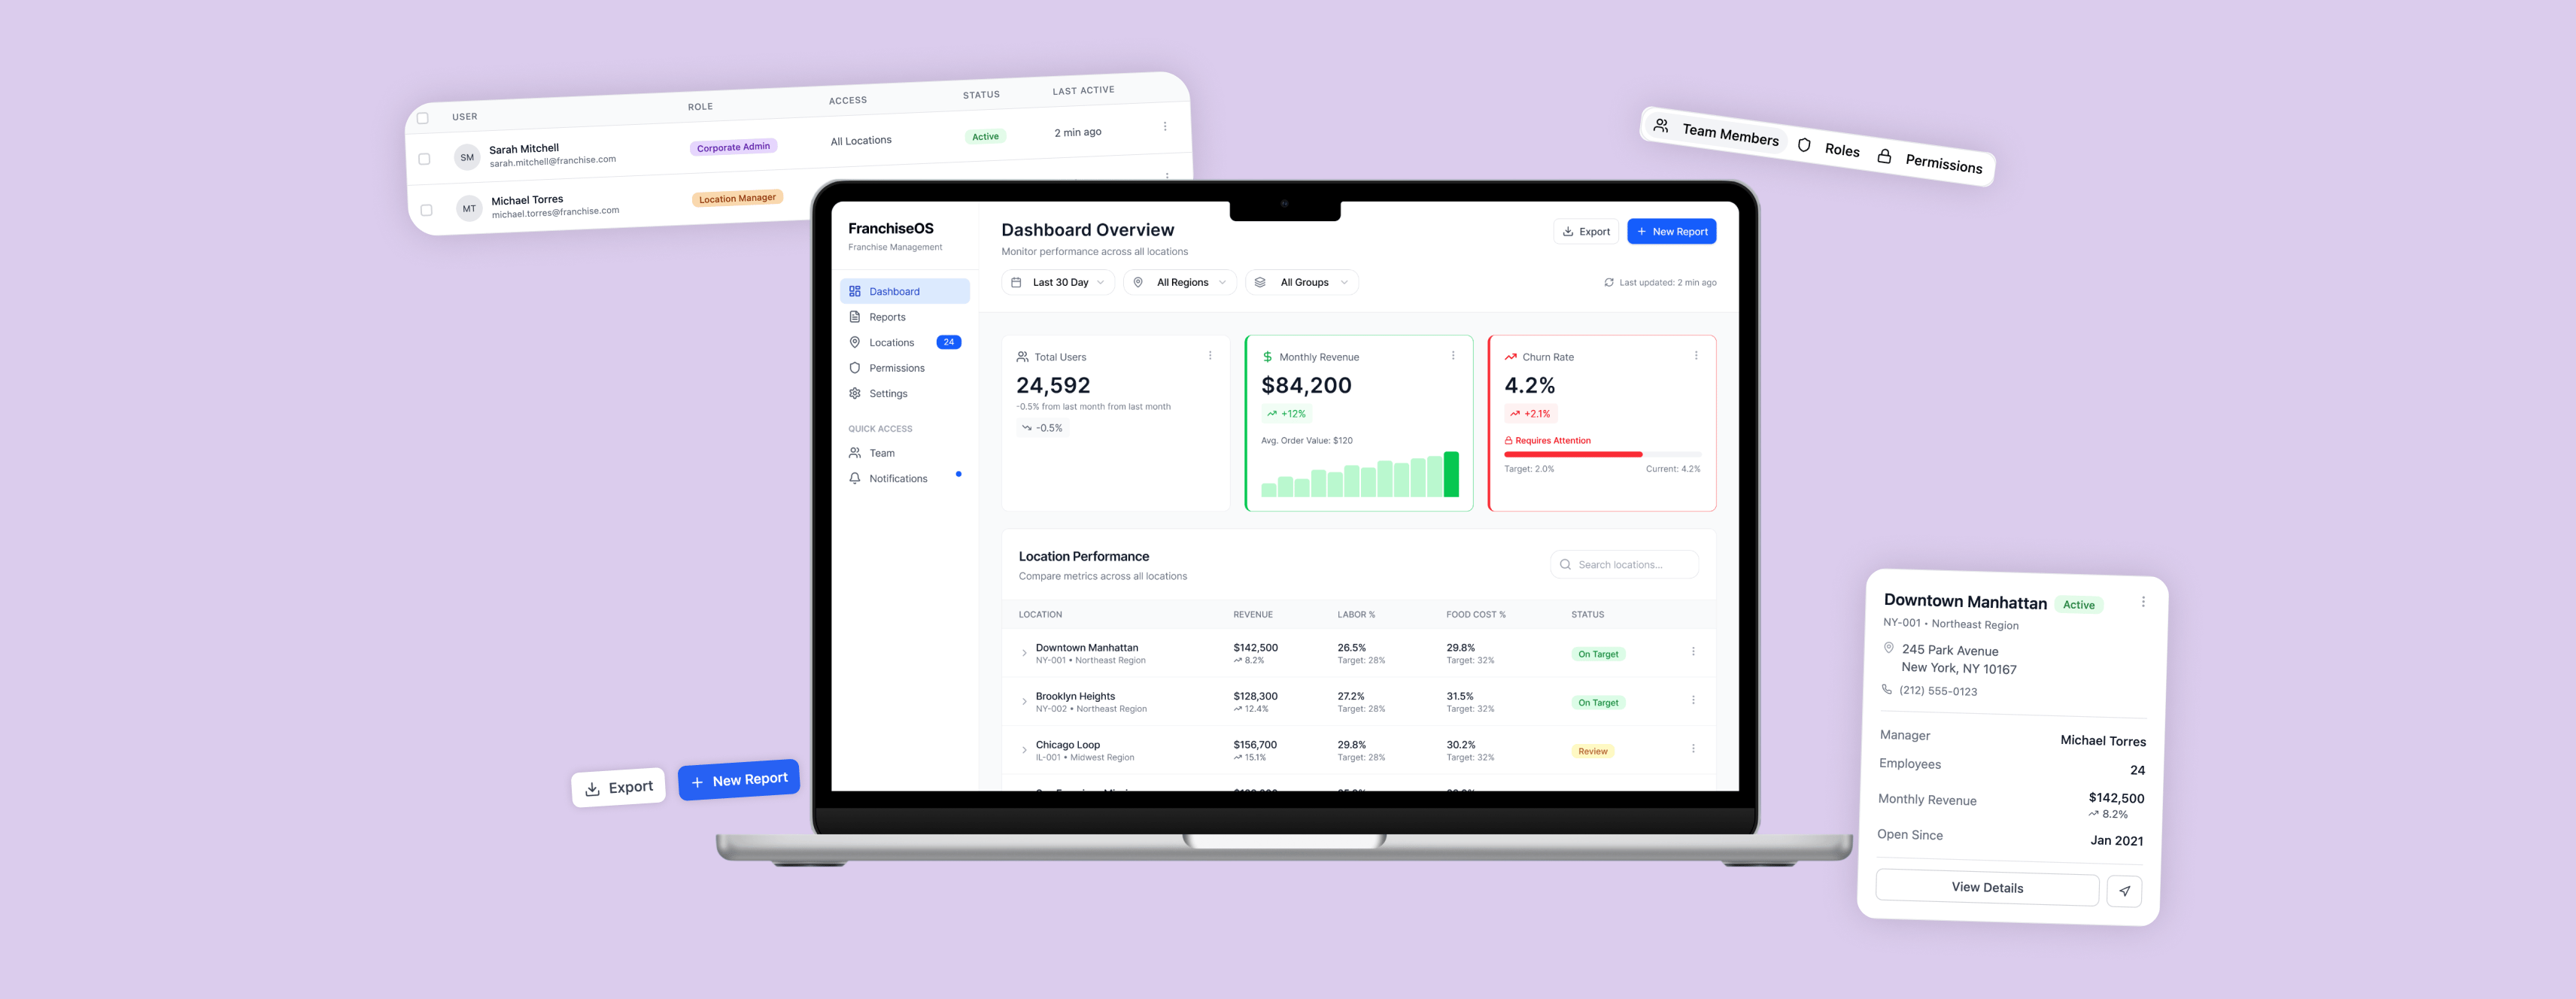
The final concept was designed as a reporting system structured around organizational hierarchy, not just data display. Instead of giving every user the same dashboard, FranchiseOS adapts visibility, comparison tools, and navigation based on role so that corporate leadership, area managers, and store managers can each move through the system with the right level of context.
Role-adaptive dashboards
The reporting experience changes according to organizational role, allowing each user to focus on the metrics, scope, and actions most relevant to them. This reduces cognitive overload while still keeping the system connected across levels.
Comparison-first reporting
A major focus of the design was making cross-location comparison fast and actionable. KPI cards, comparison tables, and drill-down patterns were designed to help users move from high-level signals into more specific store performance without losing context.
Permissions built into the product
Permissions were treated as core product architecture rather than a separate admin afterthought. Access, visibility, and governance were designed to scale with organizational structure, helping the system support both operational clarity and enterprise-level control.
Enterprise clarity without unnecessary density
The final interface balances information depth with readability. By using clearer hierarchy, structured KPI surfaces, consistent data patterns, and restrained visual styling, the product feels analytical and scalable without becoming visually overwhelming.
IMPACT
This concept demonstrates how a franchise reporting system could better support multi-level decision-making by aligning visibility, comparison, and permissions to organizational role. Instead of treating hierarchy as a filter layered on top of reporting, the design uses it as a core product structure.
Because this is a concept case study, impact is framed through the KPIs I would use to evaluate the reporting system in a pilot environment.
01
Reporting clarity
Measures whether users can understand performance across franchise, region, and store levels without needing extra explanation.
02
Cross-location comparison speed
Measures how quickly users can compare performance between locations, identify outliers, and understand where action is needed.
03
Drill-down efficiency
Measures how easily users can move from high-level KPIs into detailed store-level insights without losing context.
04
Permission confidence
Measures whether users understand what they can see, what they can manage, and why certain data is restricted based on their role.
05
Reporting workflow usability
Measures the overall ease of completing common enterprise reporting tasks across multiple organizational levels.
LEARNINGS
This project reinforced that enterprise reporting is not just a data-visualization problem. The strongest design decisions came from treating hierarchy, permissions, and scope as product structure rather than secondary admin concerns. It also showed me how important it is to balance analytical depth with clarity. In complex B2B tools, the goal is not to remove complexity entirely, but to stage it in a way that helps different users see what matters, act faster, and stay oriented within the system.
Wanna see more?
I know you wanna see more of the dashboard logic, reporting breakdowns, and all the ways I tried to make franchise data feel less like a spreadsheet nightmare. I’m happy to chat more about how I turned complex business insights into a clearer reporting experience. Reach out to me at bravomasnadia@gmail.com!
DESIGNED AND CODED BY
Nadia Bravo Mas
All rights reserved © 2026
FranchiseOS Reporting System
Designing a multi-location reporting system that helps franchise teams compare performance, manage visibility by role, and act faster across organizational levels.
TIMELINE
80 hours
ROLE
Product Designer
UX Researcher
PROJECT TYPE
Concept case study
SCOPE
Multi-location and multi-role franchise reporting system
OVERVIEW
This concept explores a more progressive approach to identity verification for a Canadian retail bank mobile app. Instead of sending every applicant through the same document-first flow, the experience starts with the least intrusive lawful verification path available, then steps up only when mismatch, product risk, or fraud signals require stronger proof. The goal was to design a verification experience that better balances compliance, privacy, accessibility, and completion by treating identity proofing as a risk-based product flow rather than a single fixed gate.
THE CHALLENGE
Multi-location restaurant franchises operate across layered organizational structures, where corporate leaders, area managers, and store managers each need different levels of visibility into performance data. Most reporting tools support individual locations well, but are not designed around multi-level franchise governance.
This created a product challenge: how might a reporting system reflect organizational hierarchy while still maintaining clarity, speed, and the right level of access for each role?
How might we help different roles see the right data without creating information overload?
How might we support cross-location comparison while preserving organizational hierarchy?
How might we make permissions and visibility feel like part of the product, not a disconnected admin layer?
STATUS QUO
Most restaurant management platforms offer dashboards, reporting views, and permissions, but they tend to optimize for either single-location operations or broad financial depth. What felt missing was a reporting experience built specifically for franchise governance — one that could adapt visibility by role, support cross-location comparison, and scale across multiple organizational levels. Rather than designing another generic reporting dashboard, this project explored how reporting could be structured around hierarchy, permissions, and decision-making responsibility from the start.
PROCESS
- Understanding the reporting problem
I started by defining the reporting challenge at the system level rather than the screen level. The core issue was not simply “show more data,” but how to structure reporting around organizational hierarchy so that different roles could see the right level of information without overwhelming the interface.
- Studying existing patterns and gaps
I reviewed existing restaurant and franchise reporting tools to understand how competitors handled dashboards, permissions, and multi-location comparison. This helped me identify a consistent gap: many tools optimized either for single-location usability or financial depth, but not for franchise-wide reporting governance as a unified experience.
- Designing around roles, hierarchy, and governance
From there, I defined the product around three core ideas: role-adaptive visibility, fast cross-location comparison, and scalable permissions. I mapped what each role needed to accomplish, then used that structure to guide feature prioritization, information hierarchy, and navigation decisions across the reporting system.
- Refining the interface into a scalable product system
From there, I defined the product around three core ideas: role-adaptive visibility, fast cross-location comparison, and scalable permissions. I mapped what each role needed to accomplish, then used that structure to guide feature prioritization, information hierarchy, and navigation decisions across the reporting system.
FINAL RESULT
The final concept was designed as a reporting system structured around organizational hierarchy, not just data display. Instead of giving every user the same dashboard, FranchiseOS adapts visibility, comparison tools, and navigation based on role so that corporate leadership, area managers, and store managers can each move through the system with the right level of context.
Role-adaptive dashboards
The reporting experience changes according to organizational role, allowing each user to focus on the metrics, scope, and actions most relevant to them. This reduces cognitive overload while still keeping the system connected across levels.
Comparison-first reporting
A major focus of the design was making cross-location comparison fast and actionable. KPI cards, comparison tables, and drill-down patterns were designed to help users move from high-level signals into more specific store performance without losing context.
Permissions built into the product
Permissions were treated as core product architecture rather than a separate admin afterthought. Access, visibility, and governance were designed to scale with organizational structure, helping the system support both operational clarity and enterprise-level control.
Enterprise clarity without unnecessary density
The final interface balances information depth with readability. By using clearer hierarchy, structured KPI surfaces, consistent data patterns, and restrained visual styling, the product feels analytical and scalable without becoming visually overwhelming.
IMPACT
This concept demonstrates how a franchise reporting system could better support multi-level decision-making by aligning visibility, comparison, and permissions to organizational role. Instead of treating hierarchy as a filter layered on top of reporting, the design uses it as a core product structure.
Because this is a concept case study, impact is framed through the KPIs I would use to evaluate the reporting system in a pilot environment.
01
Reporting clarity
Measures whether users can understand performance across franchise, region, and store levels without needing extra explanation.
02
Cross-location comparison speed
Measures how quickly users can compare performance between locations, identify outliers, and understand where action is needed.
03
Drill-down efficiency
Measures how easily users can move from high-level KPIs into detailed store-level insights without losing context.
04
Permission confidence
Measures whether users understand what they can see, what they can manage, and why certain data is restricted based on their role.
05
Reporting workflow usability
Measures the overall ease of completing common enterprise reporting tasks across multiple organizational levels.
LEARNINGS
This project reinforced that enterprise reporting is not just a data-visualization problem. The strongest design decisions came from treating hierarchy, permissions, and scope as product structure rather than secondary admin concerns. It also showed me how important it is to balance analytical depth with clarity. In complex B2B tools, the goal is not to remove complexity entirely, but to stage it in a way that helps different users see what matters, act faster, and stay oriented within the system.
Wanna see more?
I know you wanna see more of the dashboard logic, reporting breakdowns, and all the ways I tried to make franchise data feel less like a spreadsheet nightmare. I’m happy to chat more about how I turned complex business insights into a clearer reporting experience. Reach out to me at bravomasnadia@gmail.com!
DESIGNED AND CODED BY
CONTACT
Nadia Bravo Mas
Let’s build something together!
All rights reserved © 2026
FranchiseOS Reporting System
Designing a multi-location reporting system that helps franchise teams compare performance, manage visibility by role, and act faster across organizational levels.
TIMELINE
80 hours
ROLE
Product Designer
UX Researcher
PROJECT TYPE
Concept case study
SCOPE
Multi-location and
multi-role franchise
reporting system
OVERVIEW
This concept explores a more progressive approach to identity verification for a Canadian retail bank mobile app. Instead of sending every applicant through the same document-first flow, the experience starts with the least intrusive lawful verification path available, then steps up only when mismatch, product risk, or fraud signals require stronger proof. The goal was to design a verification experience that better balances compliance, privacy, accessibility, and completion by treating identity proofing as a risk-based product flow rather than a single fixed gate.
THE CHALLENGE
Multi-location restaurant franchises operate across layered organizational structures, where corporate leaders, area managers, and store managers each need different levels of visibility into performance data. Most reporting tools support individual locations well, but are not designed around multi-level franchise governance.
This created a product challenge: how might a reporting system reflect organizational hierarchy while still maintaining clarity, speed, and the right level of access for each role?
How might we help different roles see the right data without creating information overload?
How might we support cross-location comparison while preserving organizational hierarchy?
How might we make permissions and visibility feel like part of the product, not a disconnected admin layer?
STATUS QUO
Most restaurant management platforms offer dashboards, reporting views, and permissions, but they tend to optimize for either single-location operations or broad financial depth. What felt missing was a reporting experience built specifically for franchise governance — one that could adapt visibility by role, support cross-location comparison, and scale across multiple organizational levels. Rather than designing another generic reporting dashboard, this project explored how reporting could be structured around hierarchy, permissions, and decision-making responsibility from the start.
PROCESS
- Understanding the reporting problem
I started by defining the reporting challenge at the system level rather than the screen level. The core issue was not simply “show more data,” but how to structure reporting around organizational hierarchy so that different roles could see the right level of information without overwhelming the interface.
- Studying existing patterns and gaps
I reviewed existing restaurant and franchise reporting tools to understand how competitors handled dashboards, permissions, and multi-location comparison. This helped me identify a consistent gap: many tools optimized either for single-location usability or financial depth, but not for franchise-wide reporting governance as a unified experience.
- Designing around roles, hierarchy, and governance
From there, I defined the product around three core ideas: role-adaptive visibility, fast cross-location comparison, and scalable permissions. I mapped what each role needed to accomplish, then used that structure to guide feature prioritization, information hierarchy, and navigation decisions across the reporting system.
- Refining the interface into a scalable product system
From there, I defined the product around three core ideas: role-adaptive visibility, fast cross-location comparison, and scalable permissions. I mapped what each role needed to accomplish, then used that structure to guide feature prioritization, information hierarchy, and navigation decisions across the reporting system.
FINAL RESULT
The final concept was designed as a reporting system structured around organizational hierarchy, not just data display. Instead of giving every user the same dashboard, FranchiseOS adapts visibility, comparison tools, and navigation based on role so that corporate leadership, area managers, and store managers can each move through the system with the right level of context.
Role-adaptive dashboards
The reporting experience changes according to organizational role, allowing each user to focus on the metrics, scope, and actions most relevant to them. This reduces cognitive overload while still keeping the system connected across levels.
Comparison-first reporting
A major focus of the design was making cross-location comparison fast and actionable. KPI cards, comparison tables, and drill-down patterns were designed to help users move from high-level signals into more specific store performance without losing context.
Permissions built into the product
Permissions were treated as core product architecture rather than a separate admin afterthought. Access, visibility, and governance were designed to scale with organizational structure, helping the system support both operational clarity and enterprise-level control.
Enterprise clarity without unnecessary density
The final interface balances information depth with readability. By using clearer hierarchy, structured KPI surfaces, consistent data patterns, and restrained visual styling, the product feels analytical and scalable without becoming visually overwhelming.
IMPACT
This concept demonstrates how a franchise reporting system could better support multi-level decision-making by aligning visibility, comparison, and permissions to organizational role. Instead of treating hierarchy as a filter layered on top of reporting, the design uses it as a core product structure.
Because this is a concept case study, impact is framed through the KPIs I would use to evaluate the reporting system in a pilot environment.
01
Reporting clarity
Measures whether users can understand performance across franchise, region, and store levels without needing extra explanation.
02
Cross-location comparison speed
Measures how quickly users can compare performance between locations, identify outliers, and understand where action is needed.
03
Drill-down efficiency
Measures how easily users can move from high-level KPIs into detailed store-level insights without losing context.
04
Permission confidence
Measures whether users understand what they can see, what they can manage, and why certain data is restricted based on their role.
05
Reporting workflow usability
Measures the overall ease of completing common enterprise reporting tasks across multiple organizational levels.
LEARNINGS
This project reinforced that enterprise reporting is not just a data-visualization problem. The strongest design decisions came from treating hierarchy, permissions, and scope as product structure rather than secondary admin concerns. It also showed me how important it is to balance analytical depth with clarity. In complex B2B tools, the goal is not to remove complexity entirely, but to stage it in a way that helps different users see what matters, act faster, and stay oriented within the system.
Wanna see more?
I know you wanna see more of the dashboard logic, reporting breakdowns, and all the ways I tried to make franchise data feel less like a spreadsheet nightmare. I’m happy to chat more about how I turned complex business insights into a clearer reporting experience. Reach out to me at bravomasnadia@gmail.com!
DESIGNED AND CODED BY
CONTACT
Nadia Bravo Mas
Let’s build something together!
All rights reserved © 2026